
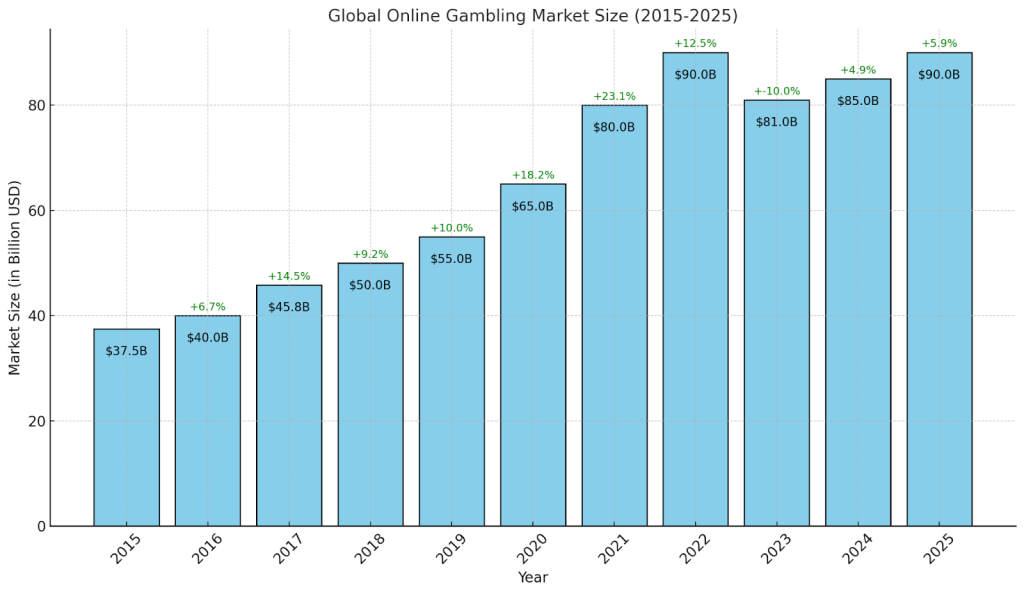
Digital technology has changed how consumers discover gaming services, interact with entertainment platforms, and make reservations for physical destinations. For casino industry analysts, digital adoption data offers a way to examine these changes. However, interpreting the data requires more than counting app downloads or website visits.
Measuring Digital Adoption
Digital adoption can be measured through several indicators, including active users, account registrations, mobile traffic, completed transactions, repeat visits, and the share of customers using digital services.
Each measure describes a different behavior. A large number of registrations may indicate initial interest, but it does not necessarily show regular use. Active-user data provides additional context, while completed transactions can help identify whether digital engagement leads to meaningful activity.
Analysts should also check how each metric is defined. A monthly active user, for example, may be counted differently across platforms, making direct comparisons difficult.
The Shift Toward Mobile Access
Smartphones have made online services accessible across more situations and locations. Depending on local law and platform availability, consumers may use mobile devices to explore gaming information, manage accounts, review offers, or access permitted digital gaming products.
Physical casino operators may also use digital tools for hotel reservations, restaurant bookings, event schedules, and loyalty programs. These services can improve convenience without replacing the on-site experience.
The extent of mobile adoption varies by age group, region, internet access, payment availability, and consumer preferences. Market-wide conclusions should therefore account for differences between user groups.
Digital Demand and Physical Destinations
Online engagement does not automatically translate into lower demand for physical casinos. Digital services may compete with land-based venues in some circumstances, while in others they complement resort activities through booking tools, loyalty programs, or online event information.
To understand the relationship, analysts can compare online activity with hotel occupancy, visitor arrivals, gaming revenue, and non-gaming spending. The timing of changes is also important, but correlation alone cannot establish that one channel caused a change in another.
A careful analysis considers wider factors such as travel costs, local economic conditions, regulation, and changes in entertainment preferences.
Data Quality and Privacy
Digital data can reveal patterns that traditional reports may not capture, but it has limitations. Duplicate accounts, automated traffic, incomplete tracking, and changes in measurement methods can distort results.
Platforms must also handle user data responsibly. Aggregated reporting, clear privacy policies, and appropriate access controls can help analysts understand trends without exposing unnecessary personal information.
Turning Adoption Metrics Into Industry Insights
Digital adoption data is most useful when combined with financial and operational indicators. Active users may reveal engagement, transaction data can show service usage, and revenue measures can help assess commercial outcomes.
No single metric fully describes changing casino demand. By comparing digital indicators with broader market evidence, analysts can better understand how consumer behavior is evolving and where digital and physical services intersect.


Comment on “What Digital Adoption Data Reveals About Changing Casino Demand”